

$111.00
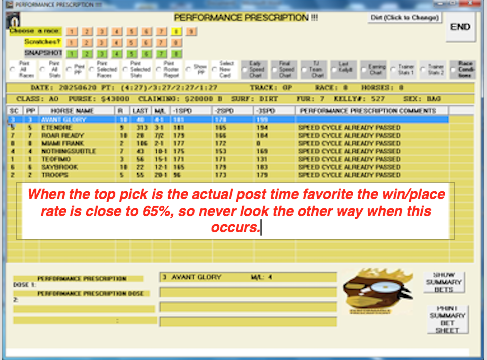
If you are satisfied with a 63% Win/Pace ratio and close to 88% Show, you are going to love this one!
Description

The Dr. is in, Dr. Tony Savage (phd, quantum engineering) that is, and he provides you with an ‘RX’ that combines some of the best Performance Ratings (including the Power Plus Ratings) in the business.
Not a longshot program by any means, 👉👉but if you are satisfied with a 63% Win/Pace ratio and close to 88% Show, you are going to love this one!
Top Notch Handicapper Tony Savage (The NYRA ‘Wizard’) is well known for his expertise in thoroughbred research and his contributions to the original Ragozin Sheets. He has recently designed a software program that has been called ‘the ultimate performance rating selection formula.’
It’s called PERFORMANCE PRESCRIPTION!, and if it’s Excellent, Super-Charged Performance from your wagers that you desire, PP 👉will increase your ticket cashing activity tremendously!
Tony tells us:
“We calculate a performance figure for every horse in every race.
This is the rating we think each horse has achieved in a particular race, given a variety of factors, and are expressed on an identical scale to handicap ratings.
When deciding on a performance figure, we watch every race multiple times in order to understand why the result turned out that way. The literal result of a race tells you only how things stood as the horses crossed the line.
We take into account everything we know about each of the runners and the specifics of the race (the racecourse, the distance, the ground, the draw, the relative weights carried, the tempo at which it was run, etc.) plus more interpretative factors such as whether a horse has started slowly, raced greenly (showing signs of inexperience) or been hampered/eased. To further illuminate this analysis, we also use a number of vital handicapping tools.
We retain performance figures for each run of every horse’s career. This profiles what we think a horse has been achieving and how they are performing in comparison to their handicap rating.”
“Now, I don’t want to confuse you, but below is the partial analysis we do to locate precision Performance Ratings. You, of course, don’t have to do a thing since these are already programmed into the software. In fact, you may want to skip the below altogether, but I wanted to include it to show you just how much detail we go into to produce our ratings.
The immense amount of information that goes into this project means most of the algorithms work in the background as showing every factor onscreen would require @124 Columns!
The starting point when setting out to produce a set of performance figures for any given race is previous form (i.e. performances) and then using the appropriate lb/length calculation to determine the relativity between the competing horses, taking into account the weights carried. It is important to note that apprentice allowances are always added back on to the weight carried when producing performance figures.
For example, in its simplest form:
1m Maiden (3yo only – all carry 9st) (good to firm ground) : 1 length = 2lbs
1st Alpha previous performances = 78
2nd 1L Beta previous performances = 80-78
3rd 0.5L Charlie previous performances = 79-79
4th 0.5L Delta previous performances = 78
The handicapper’s task is to best match the previous performances against this most recent piece of form and, using that earlier evidence as a basis, calculate the level to which each has performed.
In this particular example their job is relatively easy.
Using the appropriate calculation of 2lb/length, the basic relativities between the four horses would be:
1st Alpha 0
2nd Beta -2 (1L x 2lb)
3rd Charlie -3 (1L x 2lb + 0.5L x 2lb)
4th Delta -4 (1L x 2lb + 0.5L x 2lb + 0.5L x 2lb)
These figures reflect the fact that Alpha is 2lb superior to Beta in this race, who in turn is 1lb superior to Charlie who in turn is 1lb better than Delta.
When compared to the previous performance figures, the level for this contest is easily achieved as those are the relativities that were expected.
1st Alpha PF = 82 (+4 on previous run)
2nd 1L Beta PF = 80 (equal to previous run)
3rd 0.5L Charlie PF = 79 (equal to previous 2 starts)
4th 0.5L Delta PF = 78 (equal to previous start)
Had Alpha run out an easy winner of this race and the handicapper felt he could have won by a greater margin then they will take that into account. If the belief is that Alpha could have won the race by 2.5 lengths instead of 1 length then the relativity between Alpha and Beta will be assessed at 5lb (2.5L x 2lb) rather than 2lb and Alpha’s performance figure would be 85 (Beta at 80 +5lb) rather than 82.
Life, of course, is very rarely that simple and, unlike the above example, the majority of races feature horses carrying different weights and that has to be factored in when calculating performance figures.
Another simple example where Bravo (2nd) and Delta (4th) are fillies and are receiving the 5lb allowance (ie carrying 5lb less than the colts) which is taken into account when producing performance figures
[/stextbox]
OK, again, this is just for illustration so you know how much data crunching we do to get our numbers. And, fortunately, all the info we need is contained in the Brisnet Single Data File, which the program uses for download.
But we don’t stop there, by any means. 👉We have also included in and melded into our program some of the best Ever Performance/Speed ratings that are currently being published. We also include:
>>The BRIS Power Number — a rating that includes speed, pace, lengths beaten, etc. Top scorers hit the show spot at least 83% of the time, but even that number is enhanced when we add in everything else.
>>Beyer Speed Numbers – while this rating measures only final time, it is still a great ‘verifier’ for in-the-money performance. These, by the way, are extracted from the bris files using a very clever algorithm.
>>David Powers’ Power Plus Ratings – arguably the best in the business in that they stand alone without using other handicapping factors.
>>Kaywood’s Ultra Performance Ratings – heavy emphasis here on turn time and final fraction.
👉👀So what you are looking at is the best known and most accurate Performance Rating figures known to mankind all combined into one neat bundle.
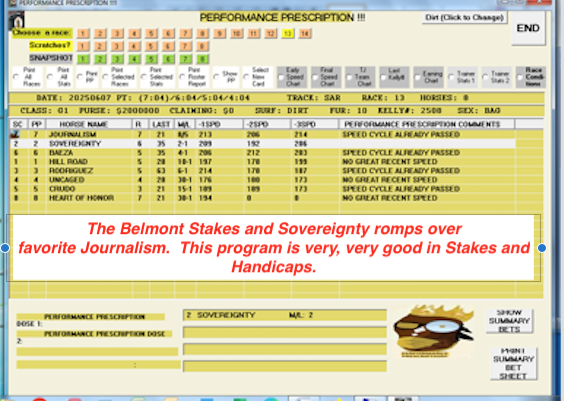
In fact, when the program picked Sovereignty over Journalism in the Belmont Stakes, many of our horseplayer friends just laughed, but we cashed in on what we considered a great overlay at $7 and change. The program suggested Sovereignty should be in the 3/5 range.
Performance Prescription! is a spot play that makes a selection only when a runner qualifies and several Performance Indicators. You will not get a play in every race. As Tony says:
“Sure, it’s fun having something to play in every race and that’s fine if you are a weekend punter. But the only way to have a serious shot at making money is to only go with the Optimal Situations, and that’s what Performance Prescription accomplishes. You will cash more often then not on your across the board wagers. While PP is ‘logic’ based, you will still get some nice prices as you will witness below.”
So if you are interested in a spot-plays software program that looks for only the best of the best performance runners, and enjoy cashing frequently, win/place/show (also great for show parlays), you will quickly warm up to Performance Prescription!
Very Fairly Priced at just $111.00. Call us at 1-800-696-0067 to order or order from our website.
Thank You!
Below you will find the Description provided by Tony’s company which provides a bit more important info.
Thank You!
Below you will find the Description provided by Tony’s company which provides a bit more important info.
Related products
-
The POWER! of the FINAL QUARTER! The ULTIMATE STRETCH-SPEED PROFIT SYSTEM!! How the ‘Final Rush’ Can Add $$$$ to Your Bottom Line!!
Price range: $53.88 through $148.00 Select options This product has multiple variants. The options may be chosen on the product page -
Sale!

Mark Graydon’s The EQUALIZER Balance-Sensitive SPEED/PACE Software Module! High Win & ITM %. See Situations Where Win Rate is 45%+!
Original price was: $138.00.$99.00Current price is: $99.00. Add to cart -
Sale!

Dan Ivory’s Thoroughbred Conductive Energy Theorem! Combining Running Styles with ‘Race Shape’ to Land on Outsized Parimutuel Payoffs!
Original price was: $111.00.$59.90Current price is: $59.90. Add to cart -

GLOBEFORM’s Breeders’ Cup PREP 15 Race Special Now Open!… Valuable Coverage & Selections for the most Important BC Preps, Beginning September 28 . BC Futures Value Bets to Boot!
Price range: $125.00 through $249.00 Select options This product has multiple variants. The options may be chosen on the product page