Original price was: $147.00.$69.90Current price is: $69.90.
Data-Point Selection Software That Exceeds Even Our Wildest Handicapping Dreams!!
Description
Data-Point Selection Software That Exceeds Even Our Wildest Handicapping Dreams!! Order Soon!
The BRIGGS CODE – The Case of the ‘Hidden Class’

If you passed him by on the street, you wouldn’t think William Briggs was anybody special. Of course, you are just looking at the man.
If you could somehow get a look into his head, however, and see how he thinks and reasons and analyzes ….. well, then you would know that you are indeed in the presence of GENIUS.
And while Mr. Briggs is involved in many endeavors, mostly of the ‘mathematical’ persuasion, aren’t we lucky that he also has applied his skills to the Sport of Kings, i.e.,
horseracing.
Mr. Briggs has created a masterful system that focuses on the myriad factors that identify ‘CLASS’, specifically ‘Hidden’ Class:
i.e., class that the vast, vast majority of horseplayers cannot identify.
He has been using it successfully for years at both the thoroughbred and quarter horse races.
When he submitted the system to Len for programming, he said: ‘I want you to give this a try — I personally feel that it will be very difficult to program accurately, but see what you can do. Charge me your normal rate and then some if you find the job too tough. Let me know.’
Len said that when he first perused the 40+ pages of type-written rules, tables, charts, graphs, etc., his brain began to ache.
However, when he realized that Mr. Briggs was largely using Data-Point theory to construct his system, he breathed a huge sigh of relief since he (Len) had already constructed data-point models for another software customer in Las Vegas and could likely transfer much of that work into a model that would fit The Briggs Code, as he decided to call it.
Data-Point Software, to make it simple, is a program that collects dozens, or hundreds, or thousands of pieces of information, and each bit of information can be referred to as a ‘data-point’.
On a graph or chart, the data collects, or ‘clusters’, along certain points of the axis depending on the criteria for that graph or chart.
So if you are examining, say, the average age of a population of a certain city of 10,000, from 1 day old to 100 years old, and ask the software to provide the average age of that population, let’s say it is 36, then a large segment of the data points will ‘cluster’ around the number 36 on the axis that went from 1 day old to 100 years old.
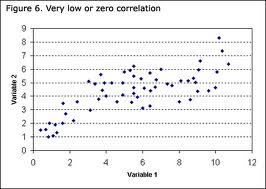
The example below, which has nothing to do with age, by the way, nonetheless illustrates that a dense cluster of data points, which can be seen in the middle of the screen, indicate when the ‘mean’ or average of the study being conducted is calculated.

Now, Data-Point graphs can also be used to provide an indication of where the ‘strength(s)’ lie in ‘predictive’science, such as our game, parimutuel wagering on the horses.
In this case the programmer predetermines what factors (these can number in the thousands), when combined, have historically resulted in positive results (in our case ‘positive results’ means cashing a bet).
And Mr. Briggs specifically designed his method of play to seek out ‘hidden’ class, or ‘past’ class.
So the horses that will receive the most data points are runners who have a proven class edge, whether you can see it in the past performances or not.
The program will then cluster data-points where the best possible outcome is expected.
So in a given horse race, given first the ‘base’ factors (class, surface, distance, sex, etc.), the program then clusters data-points at the ‘horse’, or saddle cloth number, that it deems is likely to achieve the best possible outcome.
If the chart below were expanded, you would see that the heaviest concentration of data points is above the #6 horse.
The software is saying, in other words, that given today’s racetrack, the predominate running style at today’s distance, the race conditions, and surface, #6 provides the best opportunity to cash a ticket.
The data points also attest to the ‘strength’ of this horse in this race. If the horse has just a tad more data points than the next closest horse, it may not be considered a strong play, or may not be considered a play at all.
Important: You will note in the screenshots below that if no play is found, the message will be: ‘No individual contenders’, meaning that the program sees no clear-cut contenders. Also:
***STAR RATINGS: You will also note that when there is an individual play, there may be a message to the right of the horse’s name like: *star-play, or **star-play.
A one-star (*star) play is a decent play, a two-star, a stronger play, a three-star, even better, etc.
So the more ***, or stars, the horse received, the stronger the horse’s chances of participating in a payoff.
If an individual contender is named and there are no stars to the right of his name, that means that the horse is certainly worth consideration, especially in the Exacta, but he does not have a large cluster of data points.
The Briggs Code is a dynamite Exacta program as well. Using just 2-horse or 3-horse boxes, the program will hit Exactas in the 38%+ range, some at very nice prices.
This is one of our favorite features of The Briggs Code – profitable Exacta play!
And on the Win/Place end, 2-star and up horses will hit at close to a 36% rate with an average win mutuel of $8.86, which produces a nifty +58% ROI!!
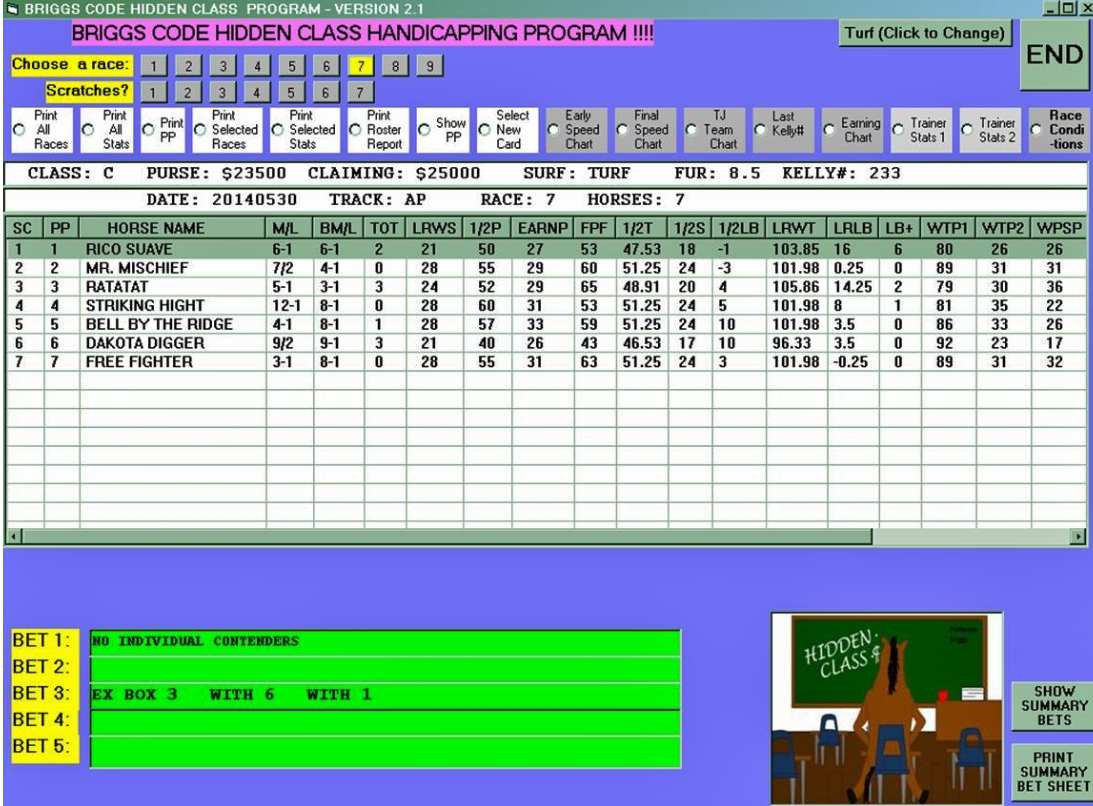
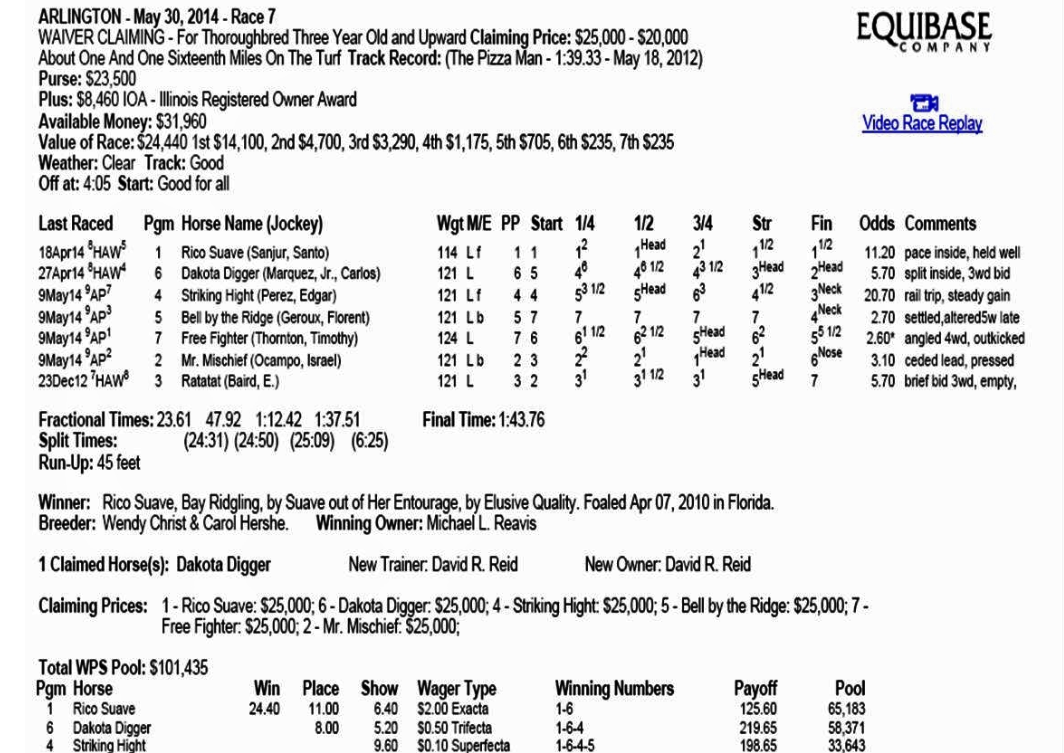
As you can see from the examples below, The Briggs Code is not only a very accurate winner and place-horse getter, but it also excels in picking Exactas. Here it simply chose a 3-horse box which returned a nice $125.60.
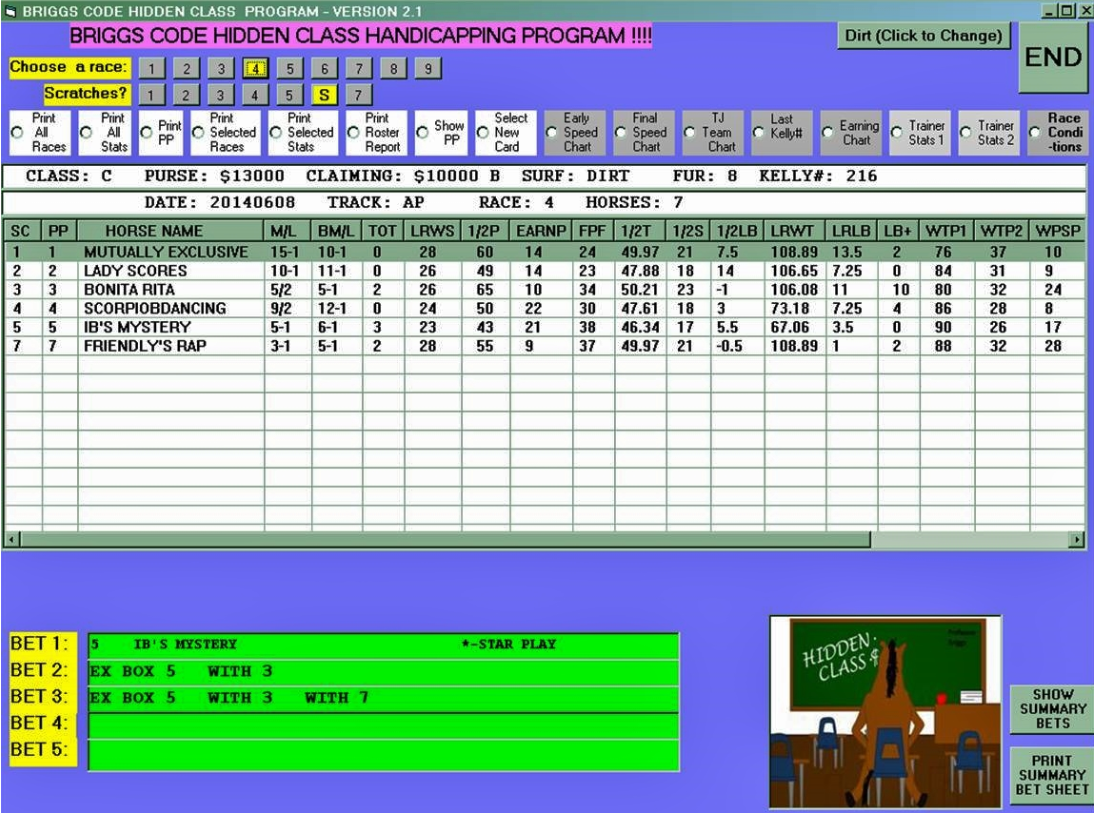
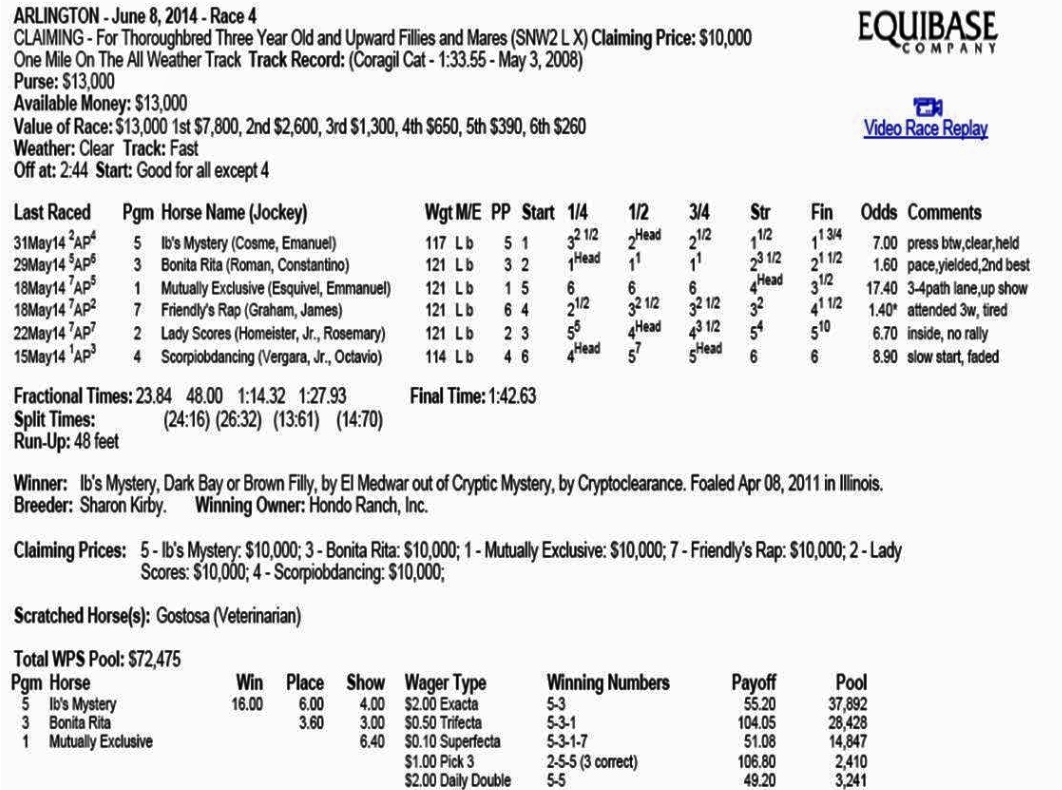
In the race below Briggs Code had the 7/1 winner clearly separated from the rest of the bunch and had the $55.20 Exacta ‘cold’ to boot.
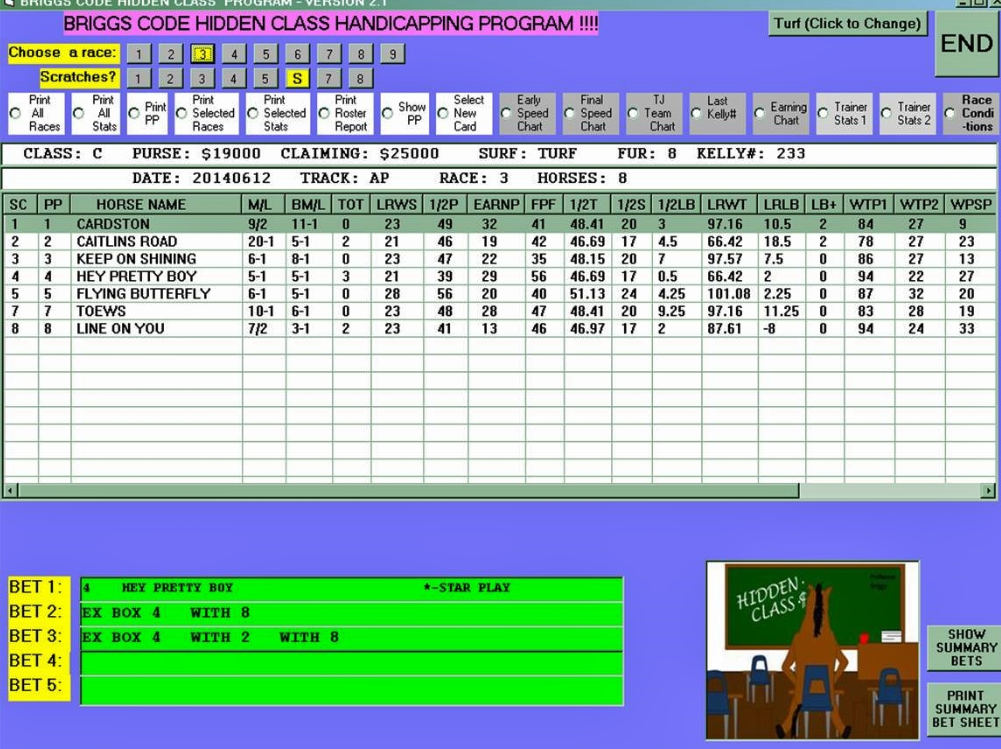
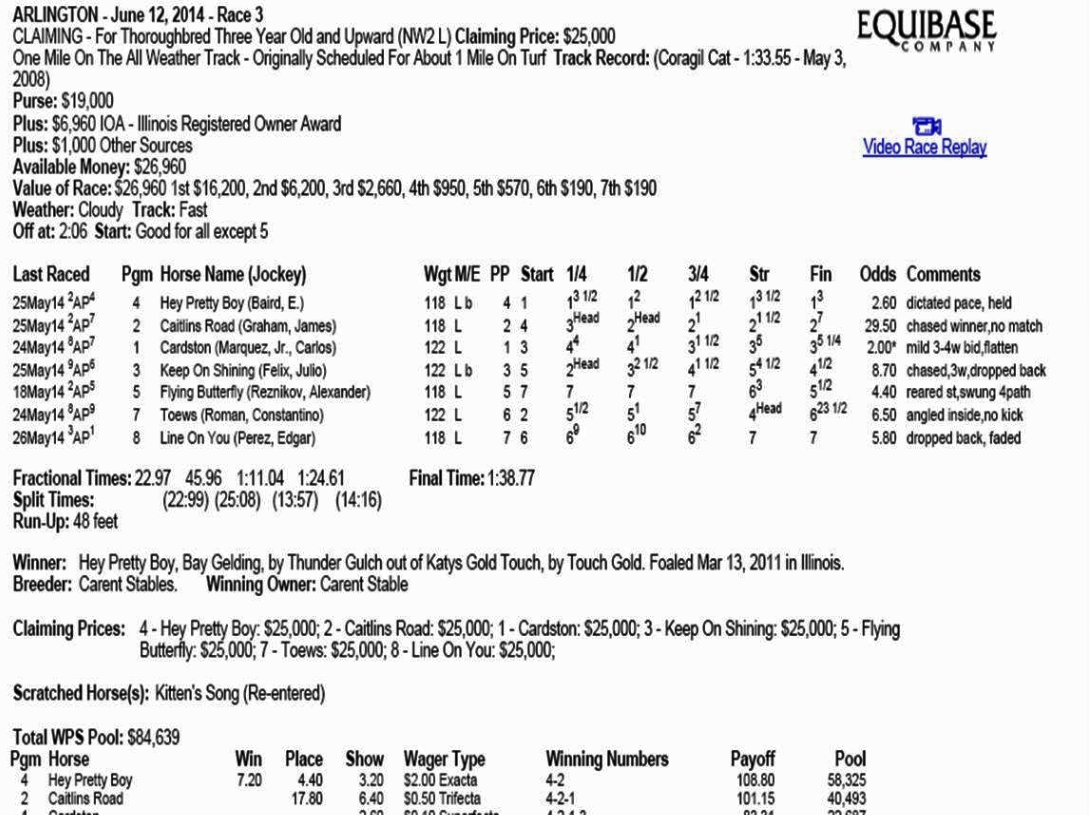
Briggs picked 5/2 winner Hey Pretty Boy — $7.20 is $7.20 – but, wait — the program also suggested a 3-horse Exacta box that included the 29-to-1 2nd-place finisher! Exacta – $108.80.
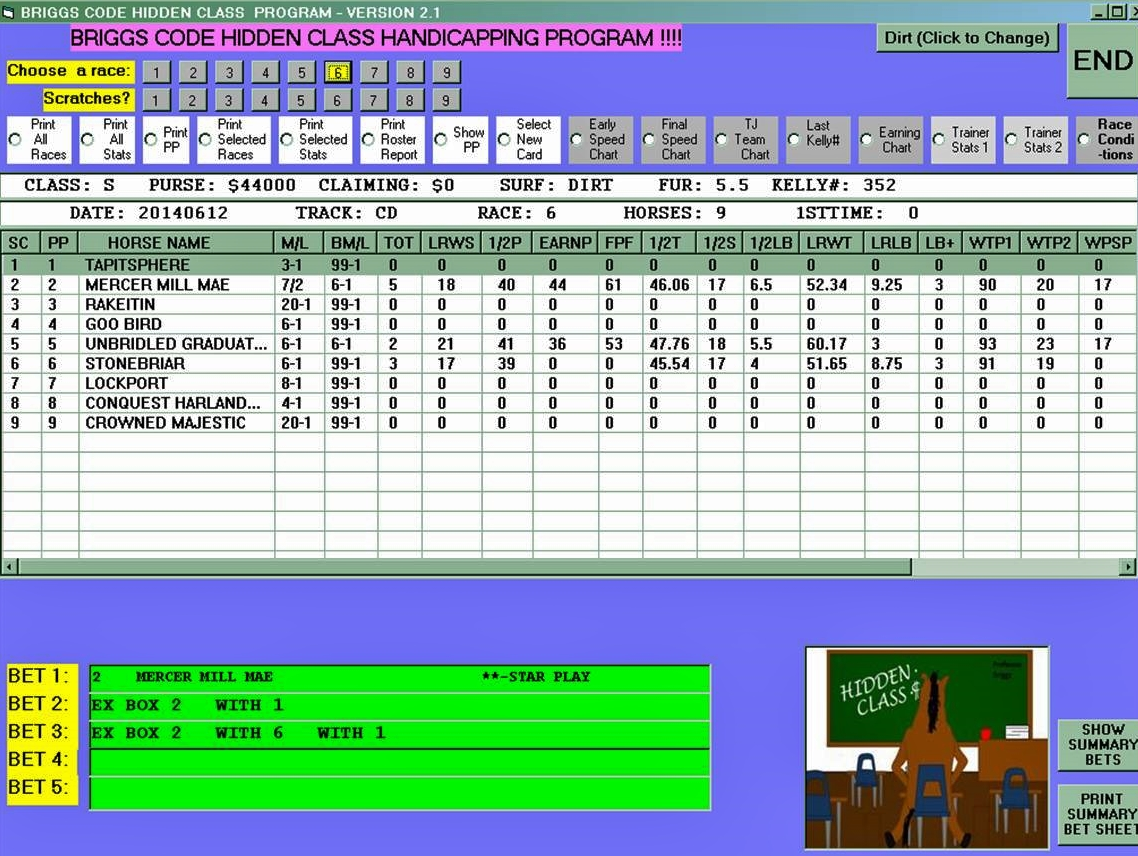
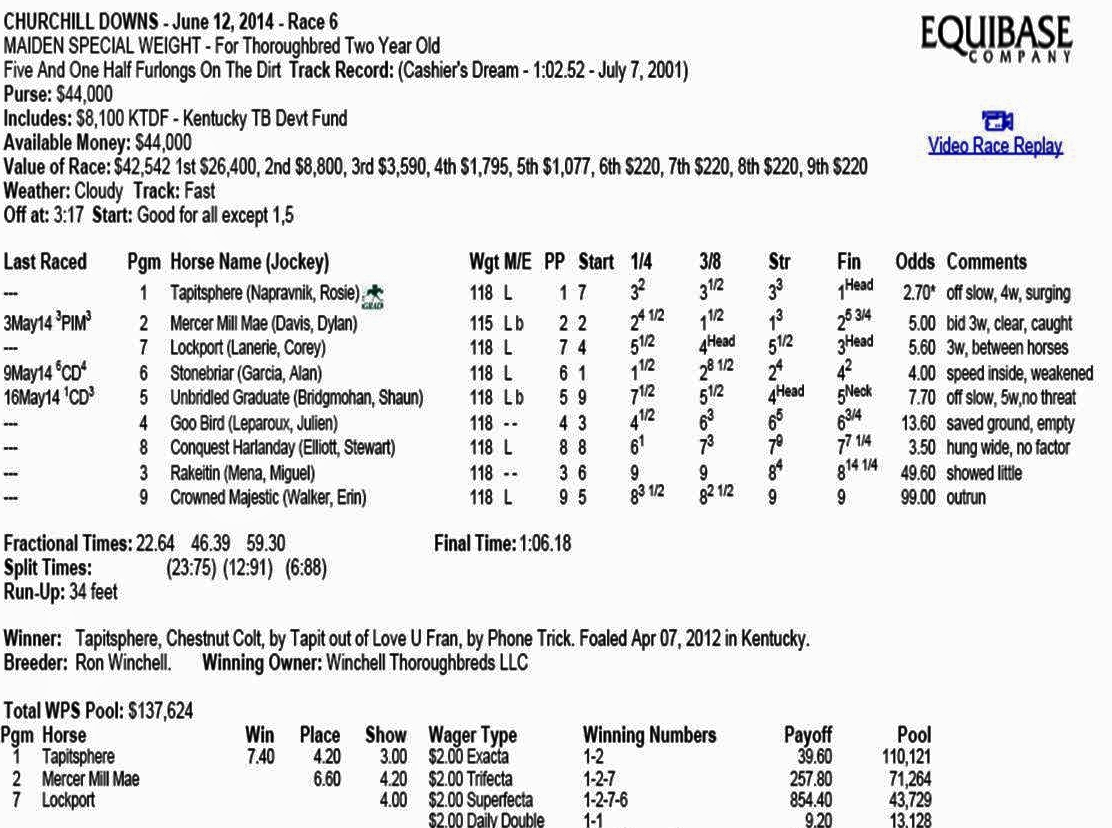
Below is an interesting situation that surfaces often. Briggs picked 5/1 Mercer Mill Mae, and even though the favorite, Tapitsphere was a first-timer, Briggs had him figured as part of the Exacta. A decent $39.60 payoff for doing nothing other than rely on the Briggs Code picks.
Once you click a race # to the right of ‘Choose A Race’ at the top of screen,
what happens next are a set of rules that are fairly complex, very specific, time consuming, and prone to human error when done with a paper and pencil.
This program will save you gobs of time, and if you equate time with money, we know you will realize the program is worth so much more than the cost.
The columns that are obvious to sort are sortable by clicking on the column header (such as M/L).
The definitions of the not-so-apparent columns, which are the most important of the BRIGGS variables, are (Note – don’t worry if these don’t make perfect sense to you — the program will do all the worrying and perform the correct calculations for you):
“BM/L”-—- BRIGGS ADJUSTED MORNING LINE — 1st of 2 top indicators
—–( WINNER TIME POINTS 2 (below) / Last 2 years Win% * 100) / WINNER TIME POINTS 2
(below) – Yes, the same number is used twice.
“TOT” – TOTAL CATEGORY POINTS
—– Lowest Briggs Morning Line (above) gets 2 points
—– Lowest Last Race Winners Score (below) gets 2 points. ALL OTHERS UNDER 21 GET 1 POINT
—– Lowest HALF MILE POINTS (below) score gets 1 point
—– Highest EARNINGS POINTS (below) gets 1 point
—– Highest FPS SCORE (below) gets 1 point
“LRWS” – LAST RACE WINNER SCORE
—– 2nd of 2 top indicators
—– Score taken from a hard-coded table with 448 entries (hard-coded means a heckuva lot of work! – but as you will see, well worth it.) Depends on race distance and Winner Time. Can range from 17 – 36. The lower the better.
“1/2P” – HALF MILE POINTS
—– 1 of top five categories
—– HALF MILE SCORE (below) + WINNER TIME POINTS2 (below) + LAST RACE LENGTHS BEHIND INCREASE (below)
“EARNP” – EARNINGS POINTS
—– 1 of top five categories
—– (Last 2 years Earnings) / (( ((Last 2 Yrs wins * .65) + (Last 2 yrs Places * .2) + (Last 2 yrs Shows * .1)) / 1000
“FPF” – FINAL PACE FACTOR
—– considered 1 of top 5 indicators
—– FINAL PACE FACTOR: WPS POINTS (18 below) + EARNINGS POINTS (08 above)
“1/2T” – 1/2 MILE TIME
—– Half Mile time of leader in last race
“1/2S” – 1/2 MILE SCORE
—– Score taken from the same table as “Last Race Winner Score”, but for ½ mile category only. Depends on “1/2 Mile Time” . Can range from 17 – 36. The lower the better
“1/2LB” – LAST RACE POC2 LENGTHS BEHIND
—– Self explanatory
“LRWT” – LAST RACE WINNER TIME
—– Self explanatory
“LRLB” – LAST RACE LENGTHS BEHIND
—– Self explanatory
“LB+” – LAST RACE LENGTHS BEHIND INCREASE
—– Final lengths behind – Poc2 lengths behind (only positive numbers considered)
“WTP1″ – WINNER TIME POINTS 1
—– 1st part of 2 part calculation: 117 – Last Race Winner Score (above) – Last Race Lengths Behind
“WTP2″ – WINNER TIME POINTS 2
—– 2nd part of 2 part calculation: Last Race Winner Score (above) / WTP1 (above) * 100
“WPSP” – ‘* WIN PLACE SHOW POINTS
—– (( ((Last 2 Yrs wins * .6) + (Last 2 yrs Places * .2) + (Last 2 yrs Shows * .1)) / .6) / (Last 2 yrs Races)) * 100 – Roughly a WPS percentage
“COMMENT” – COMMENT
—– Right now only reports a horse with no past races. Which is the only eliminator, and why you don’t see much of it.
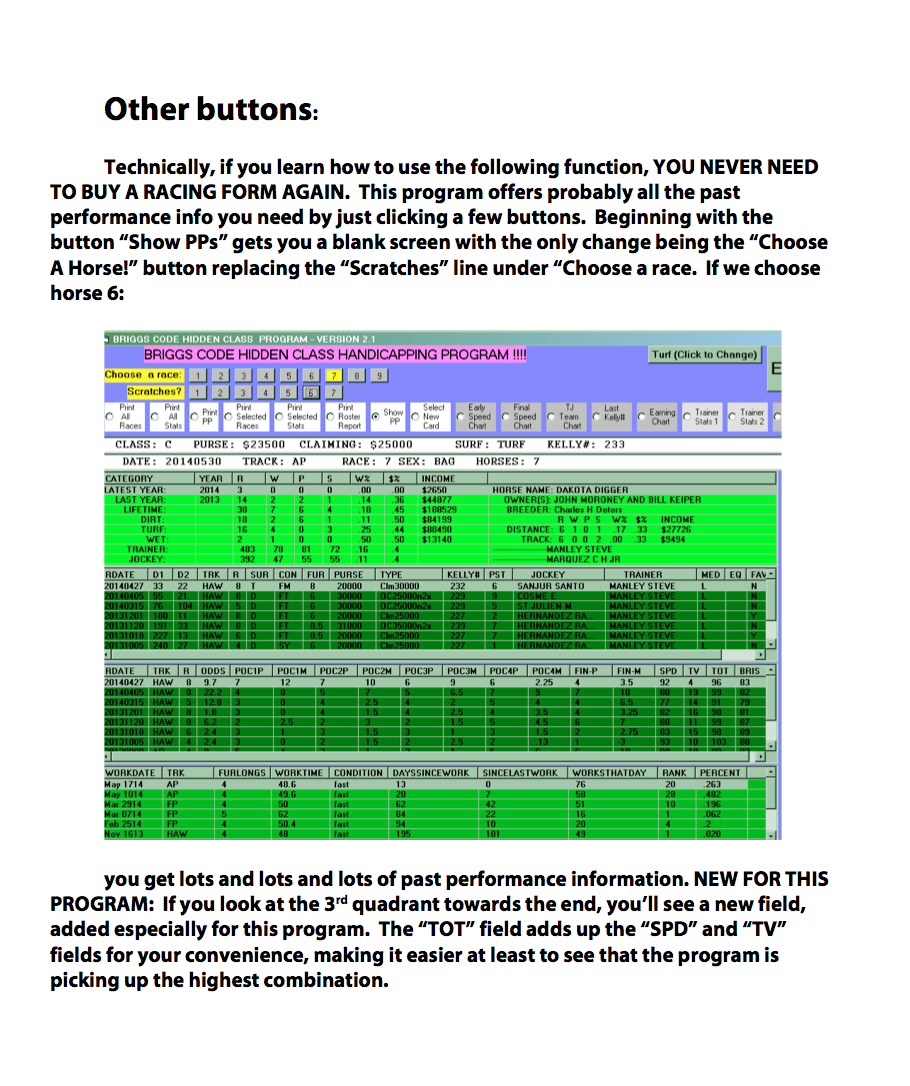
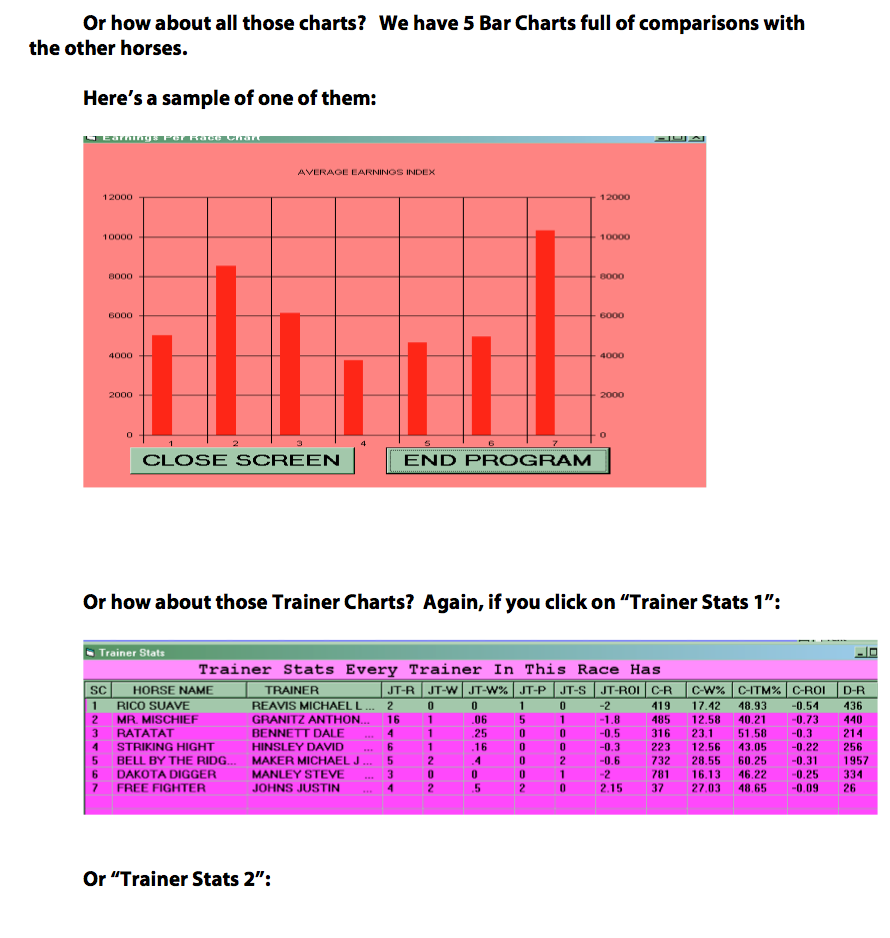
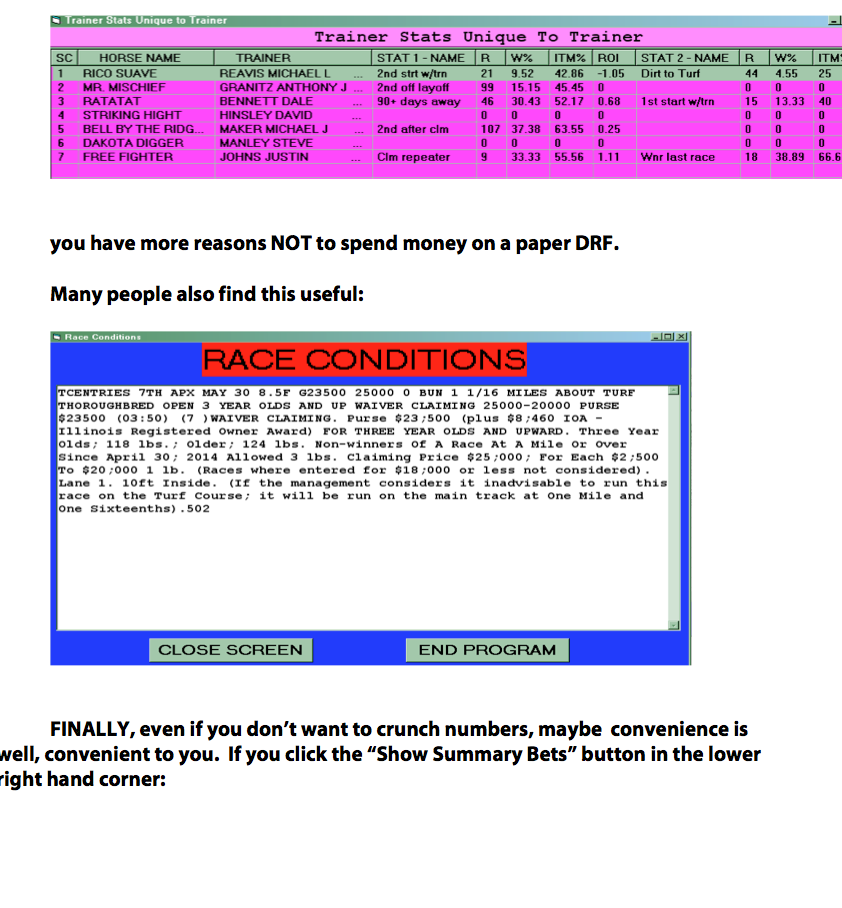
And you can see from the screen shots below that an incredible array of other important handicapping ‘helpers’ are included with the Software, such as state-of-the-art charts,
up-to-the-minute precise trainer statistics, FREE daily program, FREE Past Performances to view and/or print out.
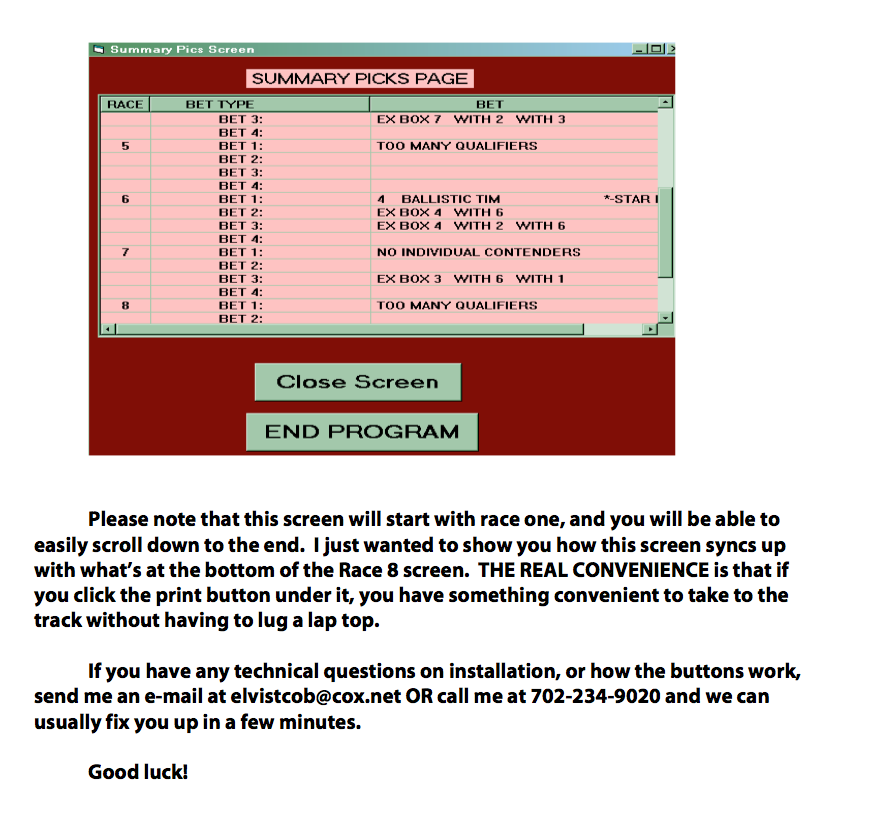
And a ‘Summary Picks Page’ that will immediately show you the recommended plays without having to open up every individual race!
